

We looked up the Z Score for -2.6 in our Normal Distribution Tables with Z Scores so you don't have to!
First, note that a Z Score of -2.6 means that your statistic is -2.6 standard deviation to the left of the mean on a bell curve. Here is a Bell Curve so you can visualize where -2.6 is on a bell curve.
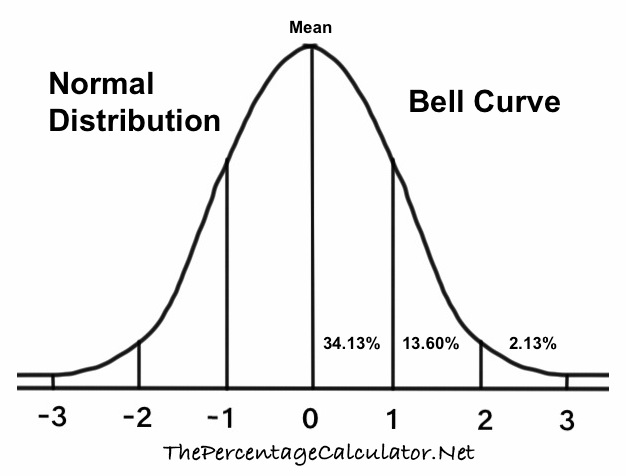
We used three different distribution tables, and we will give you the -2.6 Z Score probability, percentile, and explanations for all three.
Cumulative from mean
This gives you the probability of the area from the mean to your Z Score. The cumulative from-mean probability and percentile for a -2.6 Z score is displayed here:
0.495338811976281
= 49.5339%
Cumulative
This gives you the probability of the area below the Z Score. The cumulative probability and percentile for a -2.6 Z score is displayed here:
0.00466118802371873
= 0.4661%
Complementary cumulative
This gives you the probability of the area above the Z Score. The complementary cumulative probability and percentile for a -2.6 Z Score is displayed here:
0.995338811976281
= 99.5339%
Z Score Table Lookup
Here you can submit Z Scores between -3.999 and 3.999 for us to look up in our Normal Distribution Tables.
Z Score -2.599
Here is the next Z Score we looked up in our Normal Distribution Tables.
The percentiles on this page are rounded to the nearest 4 decimals.
Copyright | Privacy Policy | Disclaimer | Contact